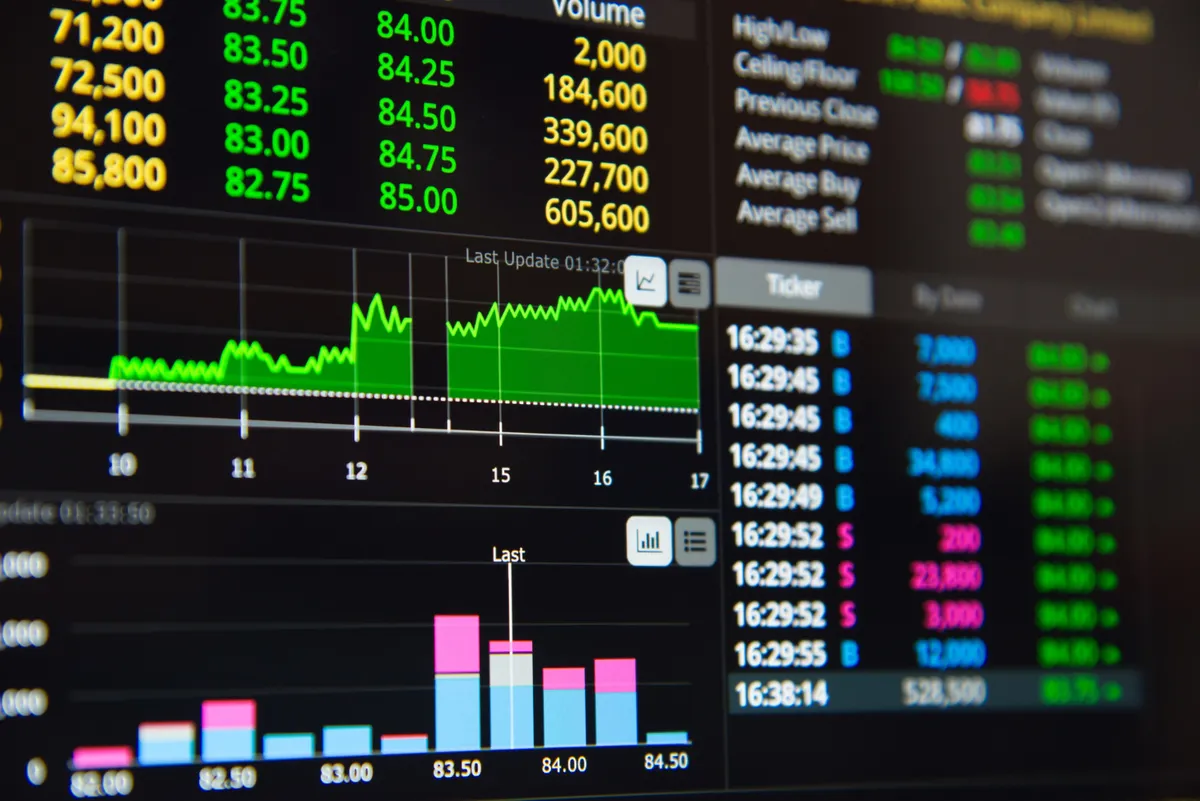
You've just opened your brokerage app, typed in a stock ticker like AAPL (Apple), and a massive, confusing chart pops up. It's covered in red and green bars, moving lines, and numbers you don't understand.
It looks like a professional trading cockpit, and your instinct might be to close the app and walk away.
Don't panic!
A stock chart is nothing more than a company’s price history translated into a visual story. You don't need a finance degree to understand the basics. You only need to know what three key elements mean.
This guide will introduce you to the fundamental components of a stock chart and teach you the language of the infamous candlesticks.
The Three Core Components
Every stock chart—whether it’s on Robinhood, Fidelity, or a dedicated platform—is built around three things.
1. Price Axis (The Y-Axis)
- Location: The vertical axis on the right side of the chart.
- What it is: This shows you the price of the stock. As the price goes up, the line or candlestick on the chart moves higher toward the top of the axis. As the price falls, it moves lower.
- Beginner Tip: This is what you care about most. If the line is trending up and to the right over a long period, the stock is making money.
2. Time Axis (The X-Axis)
- Location: The horizontal axis along the bottom of the chart.
- What it is: This shows you the timeframe. The chart can be set to 1 Day (showing movement minute-by-minute), 1 Year (showing movement day-by-day), or Max (showing the entire history of the stock).
- Beginner Tip: Always set the chart to a long timeframe (Max or 5 Years) first. This helps you avoid getting distracted by short-term "noise" and see the big, long-term trend of the company.
3. Volume Bar (The Bottom)
- Location: The bars at the very bottom of the chart.
- What it is: Volume is the number of shares that were traded during that specific time period (e.g., in that day or minute).
- What it tells you: Volume tells you about conviction. If a stock price shoots up, but the volume is very low, it might be a fluke. If the price shoots up on massive volume, it means a huge number of people have strong conviction and are actively buying the stock. High volume means big news is happening.
Decoding the Candlestick
The most common (and intimidating) type of stock chart uses candlesticks. These are the red and green vertical blocks that look like small candles. They are much more useful than a simple line chart because they tell a whole story about price action in one simple shape.
The Candlestick Story
Each candlestick represents the stock's activity over the set time period (e.g., one day, if the chart is set to "1D"). It shows four key pieces of data: Open, Close, High, and Low.
| Candlestick Type | Green (Bullish) | Red (Bearish) |
| The Color | Price closed Higher than it opened. | Price closed Lower than it opened. |
| The Body (Thick Part) | The space between the Open Price and the Close Price. | The space between the Open Price and the Close Price. |
| The Shadow/Wick (Thin Lines) | The High (tip of the top line) and the Low (tip of the bottom line) of the day. | The High (tip of the top line) and the Low (tip of the bottom line) of the day. |
Reading a Green Candlestick:
- The bottom of the solid body is the price at the Open.
- The top of the solid body is the price at the Close.
- The green color tells you the buyers won, pushing the closing price higher than the opening price.
Reading a Red Candlestick:
- The top of the solid body is the price at the Open.
- The bottom of the solid body is the price at the Close.
- The red color tells you the sellers won, pulling the closing price lower than the opening price.
The Simple Story: Wicks vs. Bodies
You can tell how volatile a day was just by looking at the candlestick.
- Long Wicks (Thin Lines): This means the price moved a lot during the day, touching high and low extremes, but ultimately came back to where it opened. Lots of fighting between buyers and sellers, but no clear winner.
- Long Bodies (Thick Part): This means there was strong, consistent momentum. If the body is long and green, buyers were in complete control all day long. If the body is long and red, sellers were in complete control.
The Beginner's Must-Watch Lines
Once you master candlesticks, your chart will likely have a few lines layered over the top. These are called technical indicators. For a beginner, you only need to look at two to get valuable context.
1. The Simple Moving Average (SMA)
Your chart will often have a smooth, curved line—this is usually a 50-Day or 200-Day Simple Moving Average (SMA).
- What it is: The average closing price of the stock over the last 50 or 200 days.
- What it tells you: It smooths out all the daily noise and shows you the true trend.
- The Golden Rule: When the current stock price is above the 200-day moving average, the stock is generally considered to be in an uptrend (bullish). When the price is below the 200-day moving average, it's generally in a downtrend (bearish).
2. The Relative Strength Index (RSI)
This indicator is usually a separate line graph that sits below the main stock chart, often fluctuating between 0 and 100.
- What it is: The RSI measures the speed and change of price movements. It is designed to tell you if a stock is overbought or oversold.
- The Key Levels:
- Over 70: The stock is likely Overbought (too many people have bought it too quickly). It may be due for a pullback or a drop soon.
- Under 30: The stock is likely Oversold (too many people have sold it too quickly). It may be due for a bounce or a rise soon.
- Beginner Tip: Don't use the RSI as a reason to buy or sell, but as a warning. If you want to buy a stock and the RSI is 85, you might want to wait a few days for the inevitable pullback.
Final Takeaway
For a new investor, you should spend 99% of your time looking at the price axis over the 5-Year timeframe. That is your long-term, wealth-building perspective.
The candlesticks and indicators are just tools to confirm the story: Are more people winning (green) or losing (red)? Is the price above or below its long-term average (SMA)? Don't let the complexity intimidate you—the most important information is still simple.