
When you first open a trading chart—whether it’s for a stock, Bitcoin, or Forex—it looks like a mess of red and green candlesticks. It tells you what the price is doing right now, but it doesn’t tell you how it’s doing it.
Is the price rising because people are genuinely excited, or is it just hype that’s about to crash? Is the drop a disaster, or a temporary discount?
To answer these questions, traders use Technical Indicators.
Think of a price chart like the windshield of a car; it shows you where you are going. Technical indicators are the dashboard.
They tell you how fast you are driving (Momentum), how much gas is left (Volume), and if the engine is overheating (Volatility).
In this trading 101 guide, we are going to break down the two most famous indicators in the world: the RSI and the MACD.
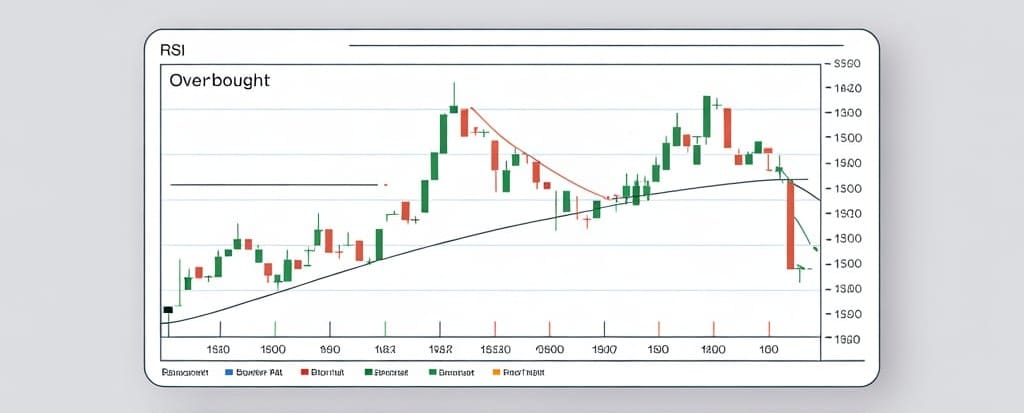
1. The RSI (Relative Strength Index)
The "Overheating" Detector
The RSI is the most popular indicator for a reason: it is simple, and it tells you if the market is acting irrationally.
Imagine a runner sprinting up a hill. Eventually, they get tired and need to stop to catch their breath. The RSI measures that fatigue. It looks at how fast the price is moving and tells you if the move is sustainable.
How to Read It
The RSI is a single line that moves between 0 and 100. You don’t need to know the complex math behind it; you just need to know two "Magic Numbers": 70 and 30.
- Overbought (Above 70): When the RSI line crosses above 70, the asset is considered "Overbought." This means buyers have been too aggressive, the price has gone up too fast, and the "runner" is exhausted.
- The Signal: The price is likely due for a pullback or a correction. It might be a good time to sell or take profits.
- Oversold (Below 30): When the RSI crosses below 30, the asset is "Oversold." This means the panic selling has gone too far.
- The Signal: The price is likely due for a bounce. It might be a good time to buy the dip.
The "Pro" Tip: Divergence
The 70/30 rule is the basics, but "Divergence" is how the pros use RSI.
- Bearish Divergence: The Stock Price makes a new high (it goes up), but the RSI makes a lower high (it goes down). This is a massive warning sign. It means the price is rising, but the strength behind that rise is fading. A crash is often coming.
2. The MACD (Moving Average Convergence Divergence)
The "Trend" Hunter
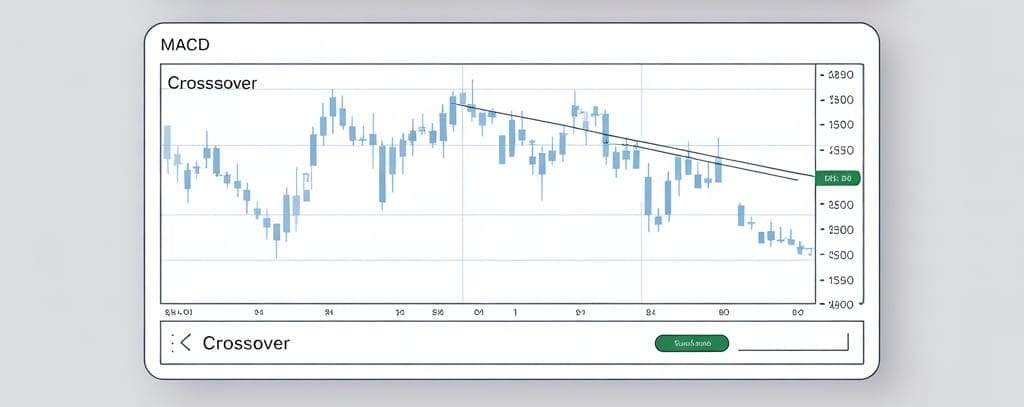
If RSI is the speedometer, MACD (pronounced "Mac-Dee") is the GPS. It tells you which direction the trend is heading and how strong that trend is.
It looks a bit scarier than RSI because it has more moving parts, but it is actually very logical. It is calculated by subtracting a slower moving average (26-day) from a faster one (12-day).
How to Read It
When you add MACD to your chart, you will see three things:
- The MACD Line (Usually Blue or Black): The fast line.
- The Signal Line (Usually Red): The slow line.
- The Histogram: The bars that grow and shrink in the background.
You are looking for Crossovers.
- The Bullish Crossover (Buy Signal): When the fast MACD Line crosses ABOVE the slow Signal Line. This tells you that short-term momentum is rising faster than the long-term average. It is like stepping on the gas pedal.
- The Bearish Crossover (Sell Signal): When the fast MACD Line crosses BELOW the slow Signal Line. This tells you momentum is dying. The car is slowing down and might start rolling backward.
The Histogram
Those little bars in the background? They show the gap between the two lines.
- If the bars are getting taller (Green), the bulls are in control and gaining strength.
- If the bars are shrinking or turning Red, the trend is losing steam.
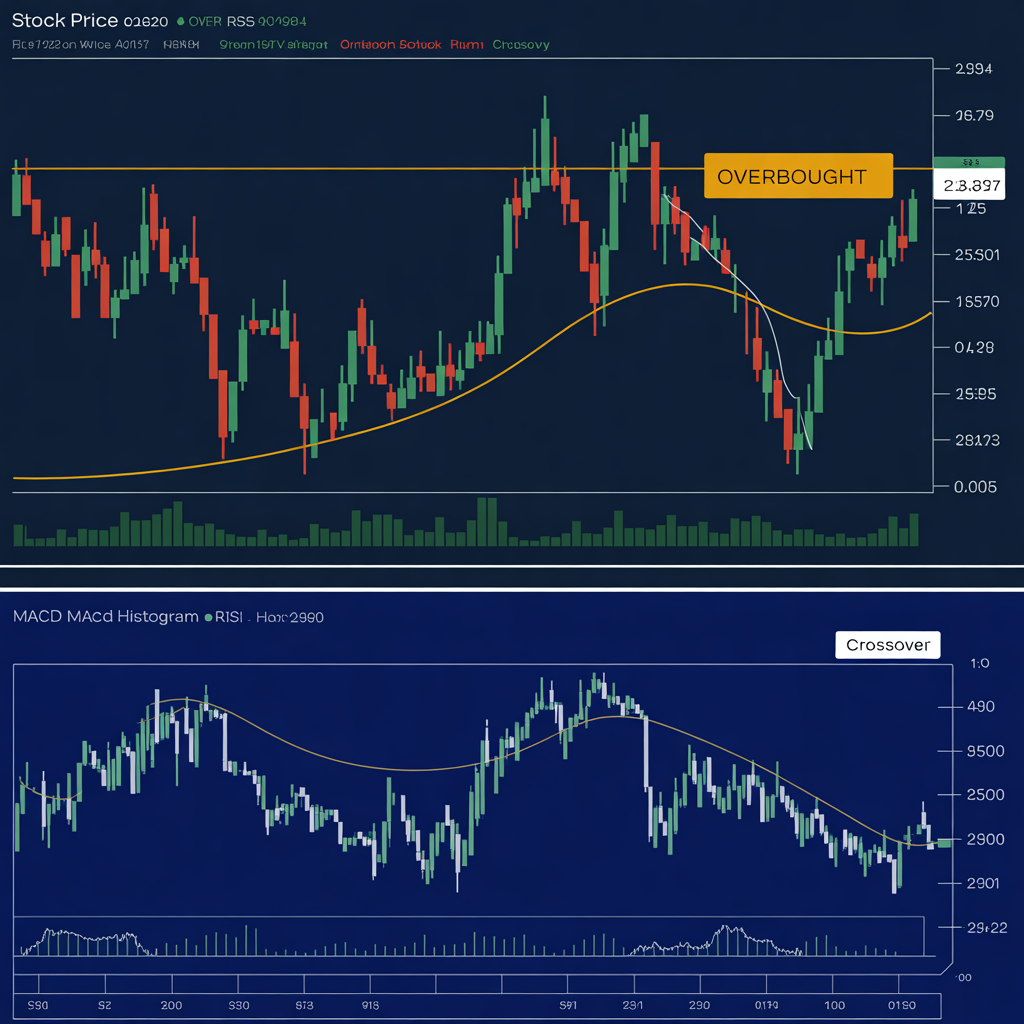
Putting It Together: The "Confirmation" Strategy
Novice traders make a fatal mistake: they use just one indicator. They see the RSI hit 30 and instantly hit "Buy," only to watch the price keep crashing.
Smart traders use RSI and MACD together for Confirmation. They act like a jury; you want a unanimous vote before you make a move.
The Perfect Buy Scenario:
- Look at the RSI: Is it below 30? (Yes = The asset is cheap/oversold).
- Look at the MACD: Did the lines just cross over into a Bullish formation? (Yes = Momentum is shifting up).
If both answer "Yes," your odds of a successful trade are significantly higher than if you just guessed.
The Limitations (Read This Carefully)
Before you go out and trade, you need to know the flaw in these tools: They are Lagging Indicators.
They are based on past data. They cannot predict the future; they only analyze history.
- RSI can stay "Overbought" (above 70) for weeks during a strong bull run. If you sold the moment it hit 70, you might have missed out on another 20% gain.
- MACD signals can sometimes come "late," telling you to buy after the big move has already happened.
Conclusion
Technical indicators are not crystal balls. They will not tell you if Apple is going to release a new iPhone or if the Federal Reserve is going to raise rates.
However, they are excellent for timing. They help you avoid buying at the absolute top and selling at the absolute bottom. Use RSI to see if the price is overextended, use MACD to spot the trend, and always use common sense as your final filter.
